
User research, Wireframing, User testing, Subject matter expert
UX design
2020

National Center for Biotechnology and Bioinformatics (NCBI) is the largest public repository for all sequences coming from scientists around the world. Building the resource that will allow customers to find, analyze, visualize and download virus sequence information is very important for academia scientists, public health researchers as well as students and teachers.
NCBI Virus is a large, ongoing project, which involves several developers, designers and subject matter experts.
My role was to review and analyze information on outdated virus resources at NCBI in order to create a new resource that replaces these historical resources and drives customers to one stop shop. I was also asked to perform user research and, together with the team, create user personas and user stories based on this research. I also had to provide the initial wireframes for the new NCBI Virus resource, and design numerous new additional elements based on user requests.


Although these websites have many complex features, they are not very intuitive to use. The UI is outdated and the fact that there were several different resources adds the extra effort to locate and access each of them.
Next step was to analyze how users were interacting with our old resources, and what features they liked, and why. I reviewed e-mail correspondence and user feedback, as well as created several user surveys, which were taken to scientific conferences and meetings.
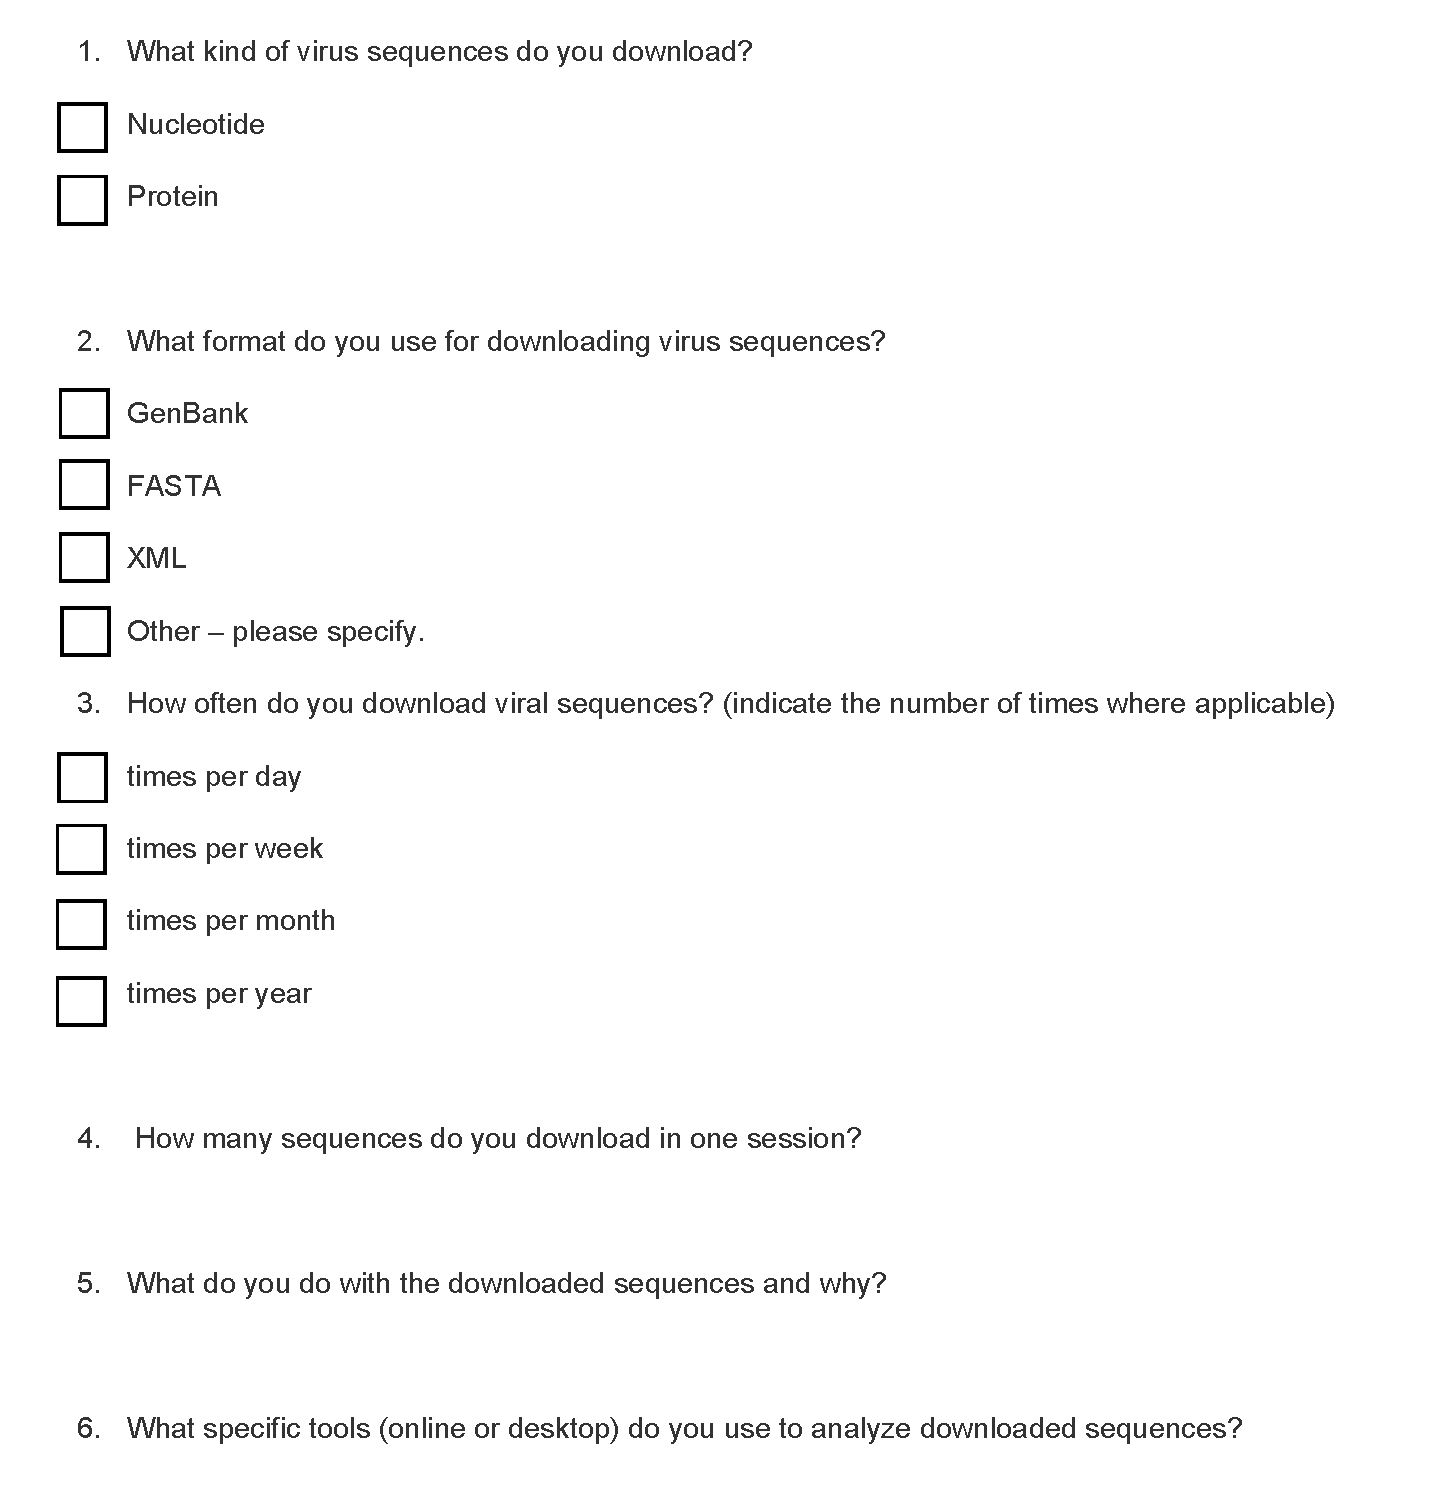

I analyzed all qualitative and qualitative research data. Based on this analisis, and my interaction with users, I came up with several user persons with their unique user stories.


After discussion with designers, developers and stakeholders, we decided to concentrate on two main user personas: Public Health Researcher and Academic Research Scientist.

Based on our research, user's goals were concentrated around three major use cases:
We divided these three major use cases into user stories accommodating each task that was important for our users.
For each element of the new NCBI virus product I provided an initial wireframe, which was taken by the design team and developed into the prototypes.
First iteration of NCBI Virus dashboard wireframe included search option based on typing the taxonomy name as well as ability to select virus on phylogenetic tree. It also included a data summary block and results table with sequence data.

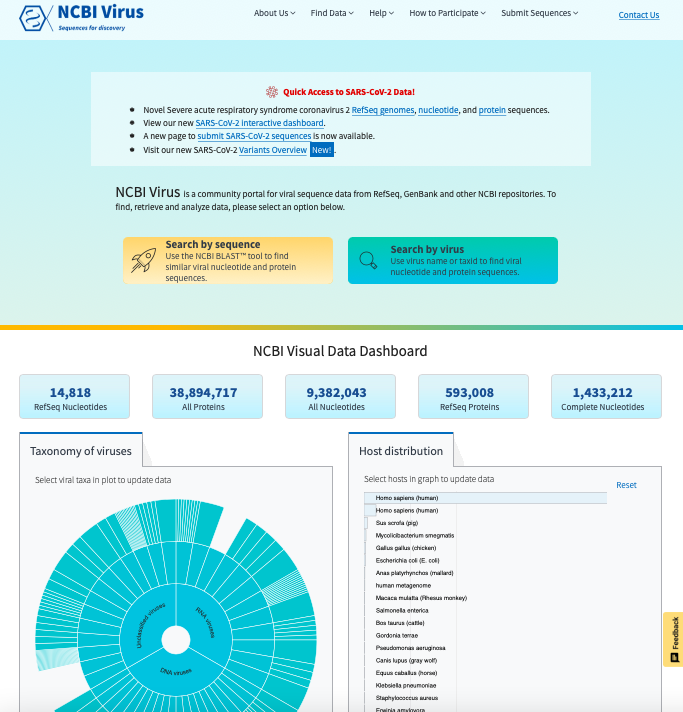
After testing with stakeholders and users, we decided to replace the phylogenetic tree to a sunburst chart, since it is a better visualization to explore virus taxonomy. We also included a geographic map showing location of selected viruses, since customers asked us to display virus geographic distribution. Because people asked us to show virus host distribution, we decided to include a bar chart showing virus host distribution. Everything on the dashboard and in the results table can be customized using the filter panel on the left.

For simplicity, the design team decided to place the dashboard and results table on separate pages, and reduce the number of interactive widgets, which can be added later.
During testing all participants asked to include an option to inter their sequence and compare it to all virus sequences in NCBI Virus database using NCBI Virus BLAST™ toolI. Based on this request I designed wireframes for sequence search.

To avoid technical difficulties, we decided to create a separate page for NCBI Virus StoreFront where users can explore data using graphical interface, search options, and quickly access data using statistics buttons. These options should lead users to a results table with multiple filters to customize data and download options can be accessed through.
My initial wireframes were modified by design team and later used by developers. This is the current view of NCBI Virus resource.


During different stages of the design process, we constantly consulted with stakeholders and users to make sure that we support their goals.
The final design was tested with 10 customers. For these sessions I created testing scripts, participated in all user interviews and user testing sessions, and analyzed their replies, which were used to fix the bugs and to create a backlog with future developments. Every participant liked the design and tools, but based on their specialization and subject of study, they had many additional requests. We continue implementing these and other requests on a daily basis. We also rely on Google Analytics and in-house usage tracking system in order to prioritize new steps.
It was a challenging and complex project that needed a high level of knowledge of the subject. There was a learning curve for our design team and developers to become involved in the project. As a Subject Matter Expert I was able to provide wireframes and speed up design process. This project continues to be a team work, were everybody supports each other.


